1
 |
Pillars United States. Feb 25 2008 00:20. Posts 1049 | | |
I know there are mixed opinions about the usefulness / veracity of PokerEV graphs, but the 'all-in' graph seems relatively reliable as it's doing pretty simple calculations.
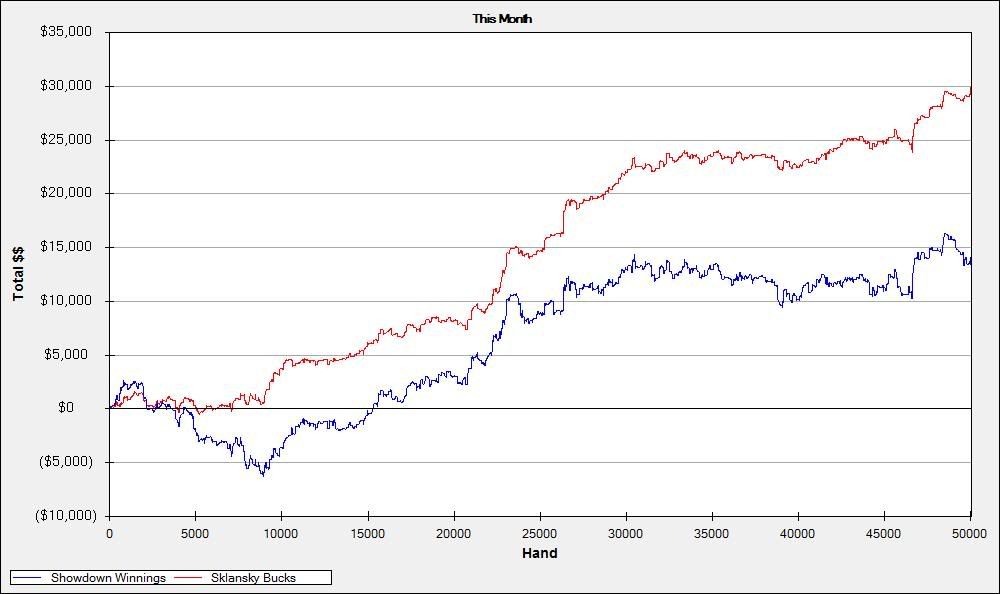
Here's my month so far, first in 'all-in luck' then in 'showdown winnings'
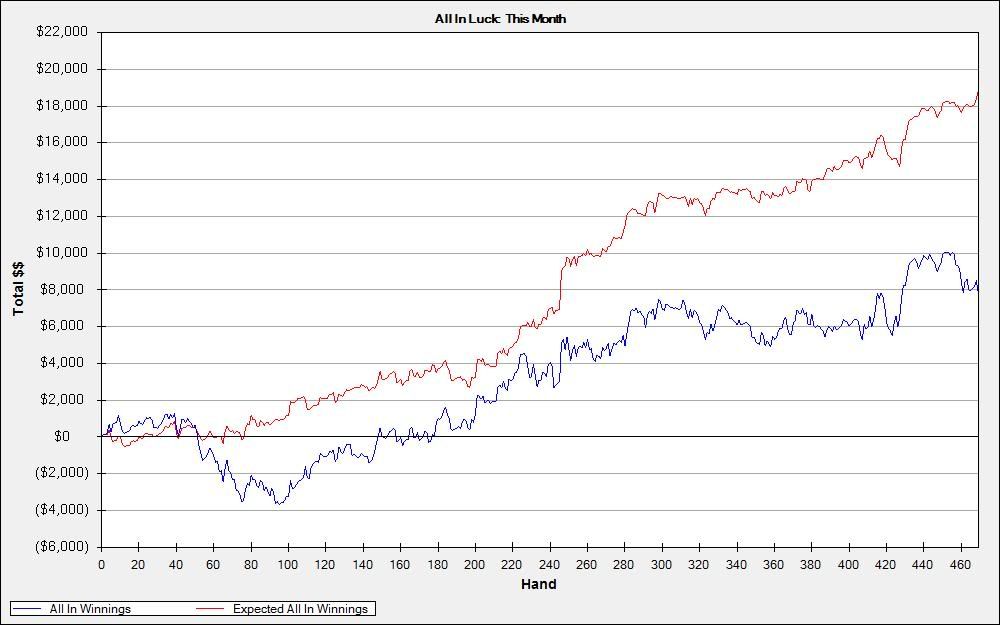
I've played about 30k hands of 3/6 6-max, 10k hands of 2/4 6-max, and 10k hands of 1/2 and 2/4 HU combined.
based on that, let's call $500 the average buy-in for the stakes I've been playing this month.
I'm down $11,000 in all-in equity, which equates to running 22 buy-ins below expectation in all-in pots.
I'm down $16,000 in 'Sklanksky bucks', which equates to running 32 buy-ins below expectation overall.
This is over 50,000 hands.

|
|
|
1
 |
Yugless  United States. Feb 25 2008 00:41. Posts 7174 United States. Feb 25 2008 00:41. Posts 7174 | | | |
|
| Baal - look is talking hah. | |
|
|
4
 |
Baalim Mexico. Feb 25 2008 00:54. Posts 34262 | | | |
|
| Ex-PokerStars Team Pro Online | |
|
|
1
 |
sOah United Kingdom. Feb 25 2008 01:03. Posts 4527 | | |
I've said it once and I'll say it again - do yourself a favour and uninstall that program and never pay attention to it |
|
| not all who wander are lost | |
|
|
1
|
Pillars United States. Feb 25 2008 01:05. Posts 1049 | | |
| | On February 25 2008 00:03 sOah wrote:
I've said it once and I'll say it again - do yourself a favour and uninstall that program and never pay attention to it |
What's the reasoning? Do you think the algorithms it uses are flawed? I can't really speak towards the Sklansky bucks chart, but the 'all-in luck' chart seems pretty accurate. |
|
|
1
|
D_Zoo Canada. Feb 25 2008 01:23. Posts 4013 | | |
these ar epretty stnd graphs. if u havent seen them before then u run like god. just uninstall the retarded program IMO |
|
| You aint a poet ur just a drunk with a pen | Last edit: 25/02/2008 01:24 |
|
|
1
|
Pillars United States. Feb 25 2008 01:31. Posts 1049 | | |
| | On February 25 2008 00:23 D_Zoo wrote:
these ar epretty stnd graphs. if u havent seen them before then u run like god. just uninstall the retarded program IMO |
I'm still not understanding the hate for the program. Are you guys questioning the data it's spitting out, or the fact that people use them to fund annoying 'I run so bad' posts?
I also don't agree that these are standard graphs. Obviously horrible runs are part of poker [even over 100k samples.] I'm well aware of that. I posted this because this is the worst I've run in my 2+ years of playing the game. |
|
|
1
|
D_Zoo Canada. Feb 25 2008 01:44. Posts 4013 | | |
wow if thats ur worse run then u should be happy man, seriously not being an ass. The graphs are very bias IMO towards showing how bad u run is what I was referring too and makes u adopt the 'feel sorry for me' approach as opposed to fixing possible leaks or weak spots in ur game even for good players. Im saying this cuz it happened with me and lots of people I know so nothing meant negative towards u at all.
and if these graphs aren't fairly stnd for u then i wish i was u! =) |
|
| You aint a poet ur just a drunk with a pen | Last edit: 25/02/2008 01:46 |
|
|
0
| |
and yet the questions remains... in what way these graphs are flawed?
I am talking about the all-in showdowns cause you can have 2 values
a) $ amount
b) your equity
this gives one graph,
the other is the actual wins, and in the long run they should match or and short term kindda play around each other, sometimes up and down.
|
|
|
0
| |
Personally I was just curious to graph these, I wasn't making excuses or anything at all... its something I did after going over my hands and just for the fuck of it basically... |
|
|
1
|
Pillars United States. Feb 25 2008 02:26. Posts 1049 | | |
I guess it depends what you mean by 'worst run'. In terms of money lost in a medium time frame, it was probably like $12,000 [20 buy-ins] playing 3/6 6-max sometime last year. Over maybe 20,000 hands.
Even though I'm still [barely] making month this month, I feel like this run is WORSE as I'm running over 30 buy-ins below expectation over a much, much longer period of time.
In terms of PokerEV itself, yeah it's obviously not the most useful for picking out specific leaks. I think there is some value in studying the difference between one's showdown winnings [blue line] vs total winnings [green line.] |
|
|
1
|
sOah United Kingdom. Feb 25 2008 02:48. Posts 4527 | | |
the question you should be asking yourself is what the hell are you getting out of being able to put a 'number' on how bad you're running? nothing but bad things can come of this so there's the only answer you will ever need. |
|
| not all who wander are lost | |
|
|
0
| |
sOah, I agree with you man. In fact all graphs are stupid and waste of time... still neat to look at it at the end of the day.
I am looking for a mathematical explanation or just a technical description of why the ALL-IN graph is flawed...even if its just inaccurate it should give a rough magnitude of your equity lost to suckout. |
|
|
1
|
Pillars United States. Feb 25 2008 03:08. Posts 1049 | | |
| | On February 25 2008 01:48 sOah wrote:
the question you should be asking yourself is what the hell are you getting out of being able to put a 'number' on how bad you're running? nothing but bad things can come of this so there's the only answer you will ever need. |
Wait, should I still ask myself the question when you've already given me the answer? 
I think you're kinda over-reacting. I wanted to make a short blog post about my recent bad run, and the PokerEV graphs seemed like a nice way to supplement the post. That's it.
Certainly wallowing over a bad run of cards isn't going to be helpful to my long-term success, but that's not what I'm trying to do here. |
|
|
1
|
sOah United Kingdom. Feb 25 2008 03:20. Posts 4527 | | |
| | On February 25 2008 02:08 Pillars wrote:
Show nested quote +
On February 25 2008 01:48 sOah wrote:
the question you should be asking yourself is what the hell are you getting out of being able to put a 'number' on how bad you're running? nothing but bad things can come of this so there's the only answer you will ever need. |
Wait, should I still ask myself the question when you've already given me the answer?
I think you're kinda over-reacting. I wanted to make a short blog post about my recent bad run, and the PokerEV graphs seemed like a nice way to supplement the post. That's it.
Certainly wallowing over a bad run of cards isn't going to be helpful to my long-term success, but that's not what I'm trying to do here.
|
"over-reacting"? lol I'm not reacting to anything other than the fact that people seemed genuinely surprised that I consider this program more destructive than it is constructive. I gave you my answer to the question I would recommend you ask yourself and fwiw I obv QFT all of D_Zoo's posts here, you are a lucky pos if this is the worst run you've ever had lol!
So you're not trying to wallow over a bad run of cards, you're trying to vent frustration with this being a very effective method for some to do so - that's cool  carry on if it works for you imo carry on if it works for you imo |
|
| not all who wander are lost | |
|
|
1
|
sOah United Kingdom. Feb 25 2008 03:23. Posts 4527 | | |
| | On February 25 2008 02:00 tilted fish wrote:
sOah, I agree with you man. In fact all graphs are stupid and waste of time... still neat to look at it at the end of the day.
I am looking for a mathematical explanation or just a technical description of why the ALL-IN graph is flawed...even if its just inaccurate it should give a rough magnitude of your equity lost to suckout. |
yea they're neat
the All-In graph may not be 'flawed' in itself but the fact that poker is much MUCH more than what can be measured by the All-In expectation should be enough to get you off this program for good. You find some 'true LAGs' that break-even more or less at showdown but crush for over 5ptbb/100 - just some food for thought. |
|
| not all who wander are lost | |
|
|
1
|
Silver_nz New Zealand. Feb 25 2008 04:52. Posts 5647 | | |
hope you get out of the rut soon. I'd send you my luckbox if I could~ |
|
|
1
 |
b97531 Australia. Feb 25 2008 08:27. Posts 58 | | |
The allin luck is definitely 100% accurate. The skalansky could be somewhat suspect. But for the allin luck, assuming average allin is for 1k pot (500 each), you're only 1 standard deviation below expectation (16% chance of this happening or worse every 460 allins). So it's not really that bad at all - it's just the same as aa losing to kk. If you were 2 or 3 standard deviations below then you probably do have something to bitch about |
|
|
1
|
Pillars United States. Feb 25 2008 08:33. Posts 1049 | | |
| | ...16% chance of this happening or worse... |
Wow.
I really thought this would be somewhere close to 5%.
Maybe I'm still carrying some residual sensitivity from the poor run expectation-wise of last month...
Thanks for that number, btw. |
|
|
|
 Contact Users: 1118 Active, 1 Logged in - Time: 11:44


